- Serious Game Design
- UX Research
- Brand Design
LEARNING STATISTICS THE FUN WAY
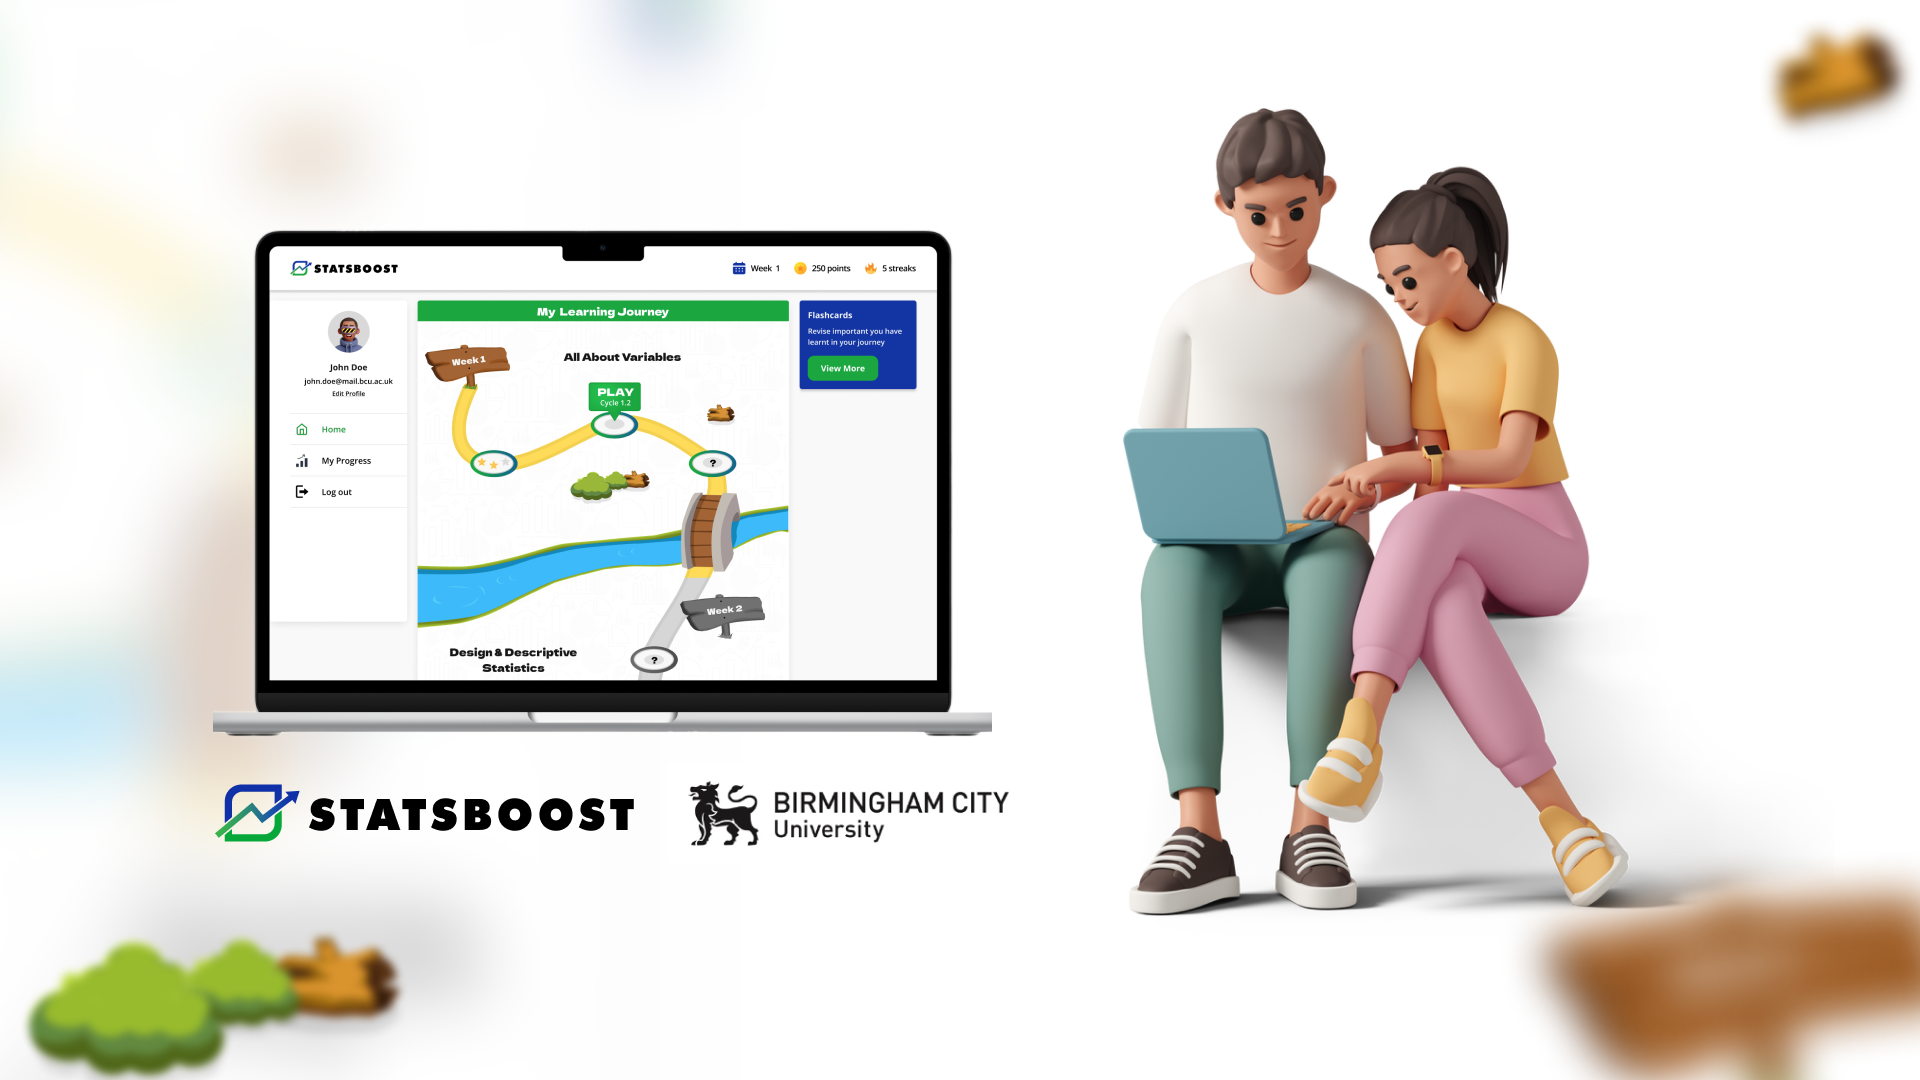
This 18-week collaborative project, in partnership with the Department of Psychology at Birmingham City University, aimed to revitalize a statistics intervention for psychology students. Our multidisciplinary team, led by the Deputy Leader of the User Experience Design Course, researched, redesigned, and evaluated the existing intervention, transforming it into an engaging statistics serious game.
My Role:
- Collaborative Design: I actively collaborated with my team under the supervision of the Deputy Leader of the User Experience Design Course.
- User-Centered Design: Conducted user research on gamification elements, journey maps, and the use of flashcards in statistics serious games. This research informed the design decisions for the user experience.
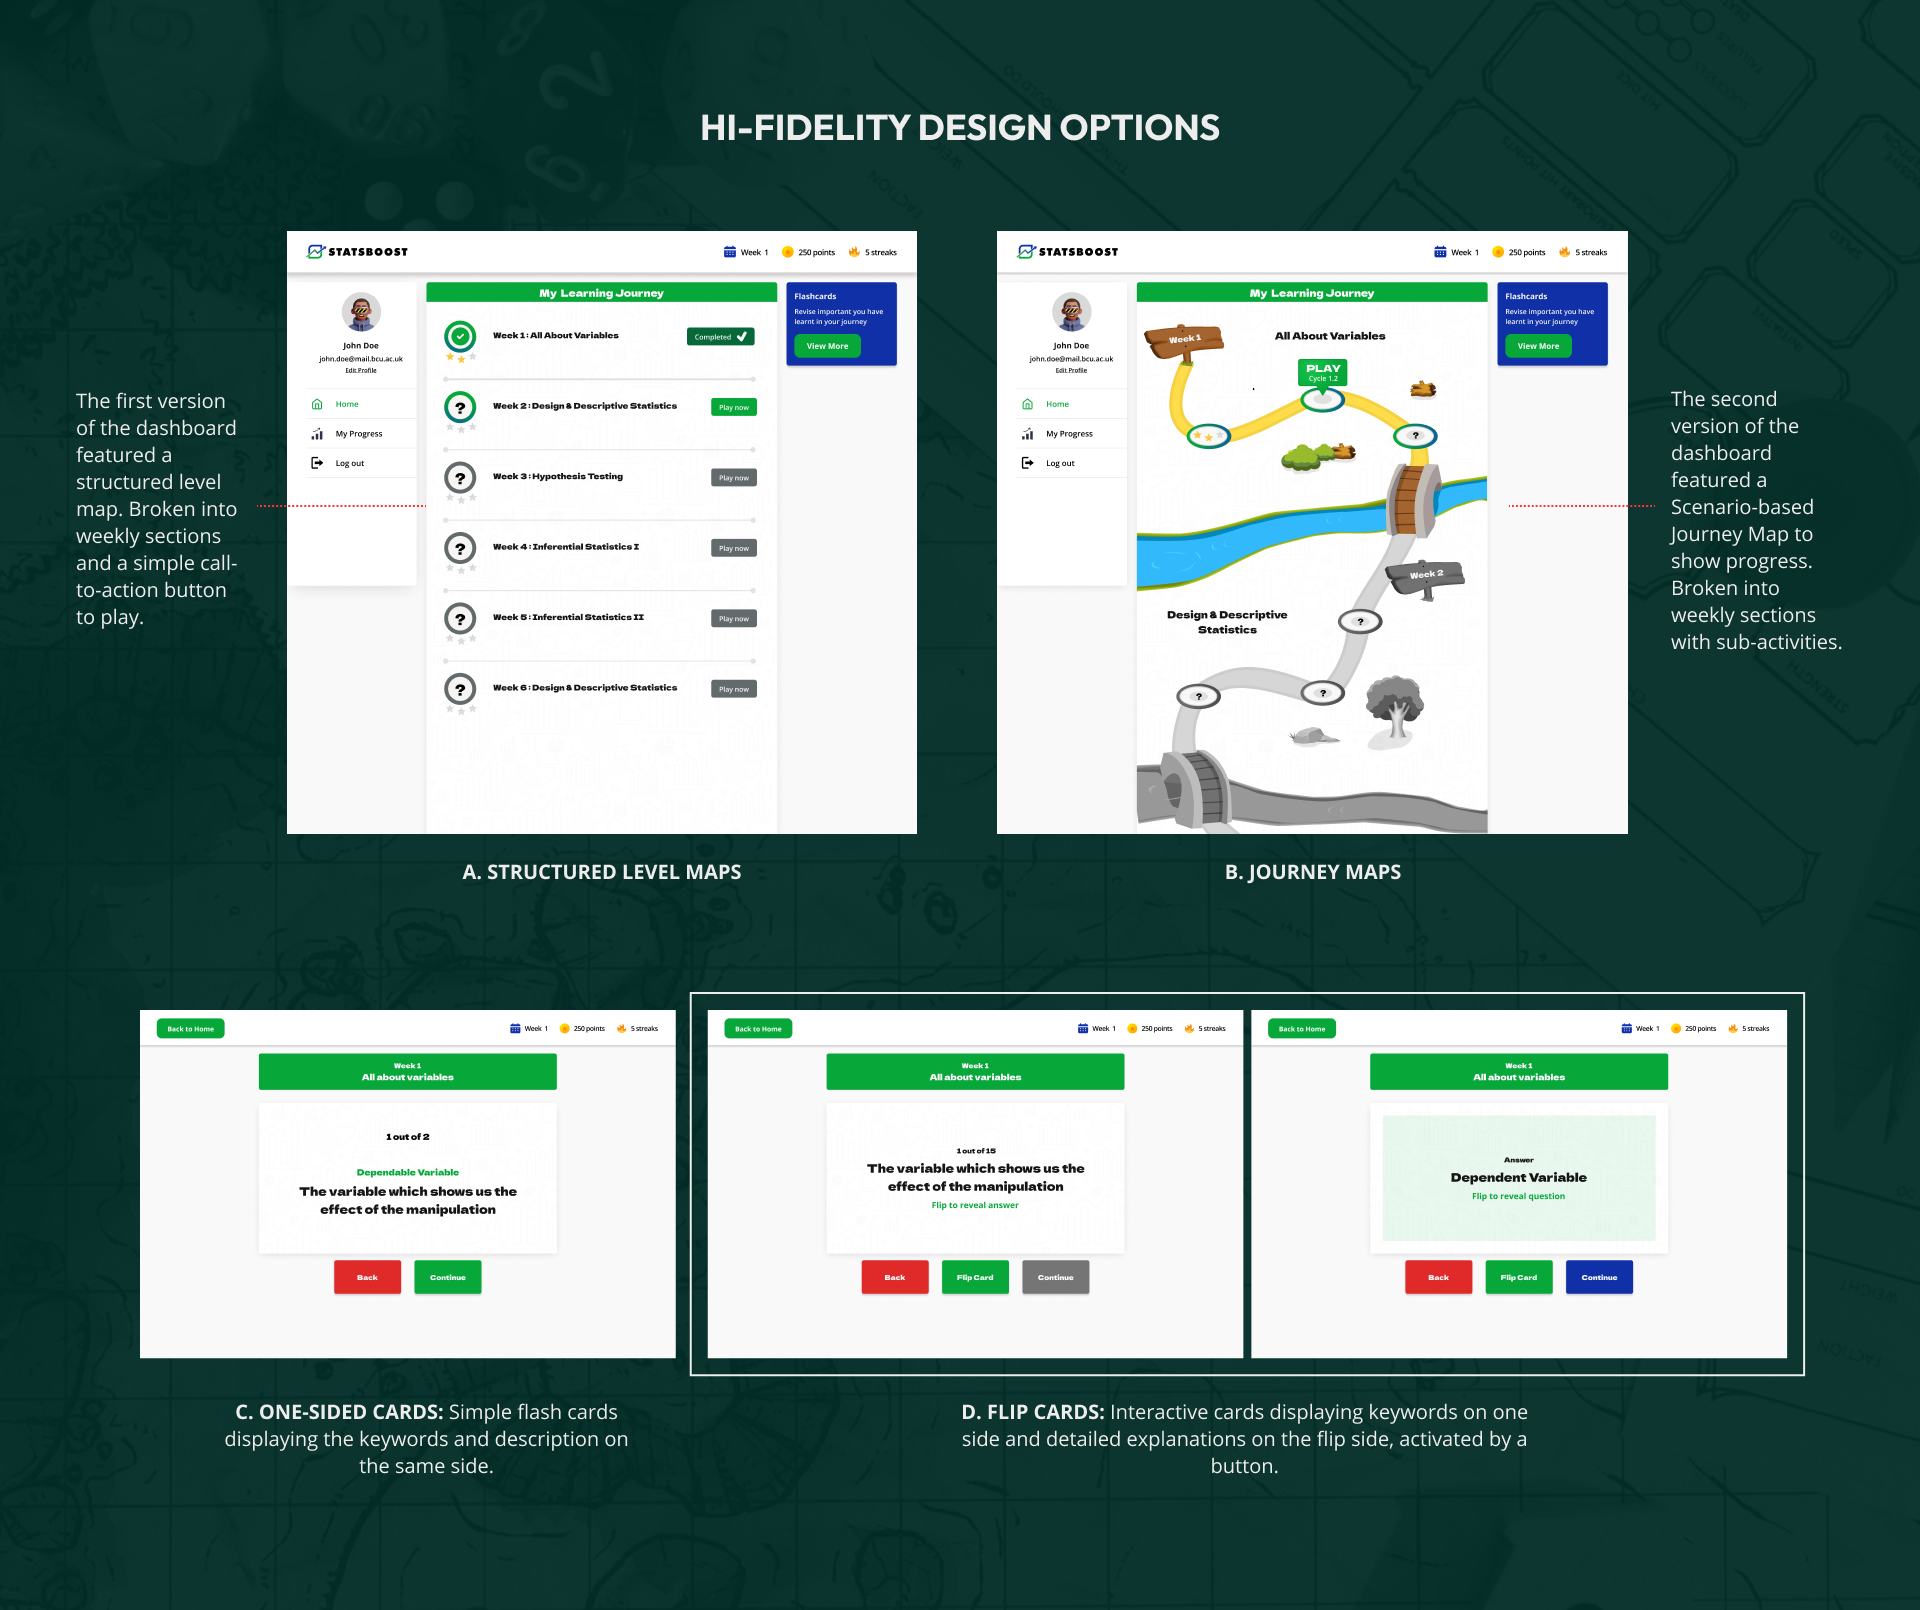
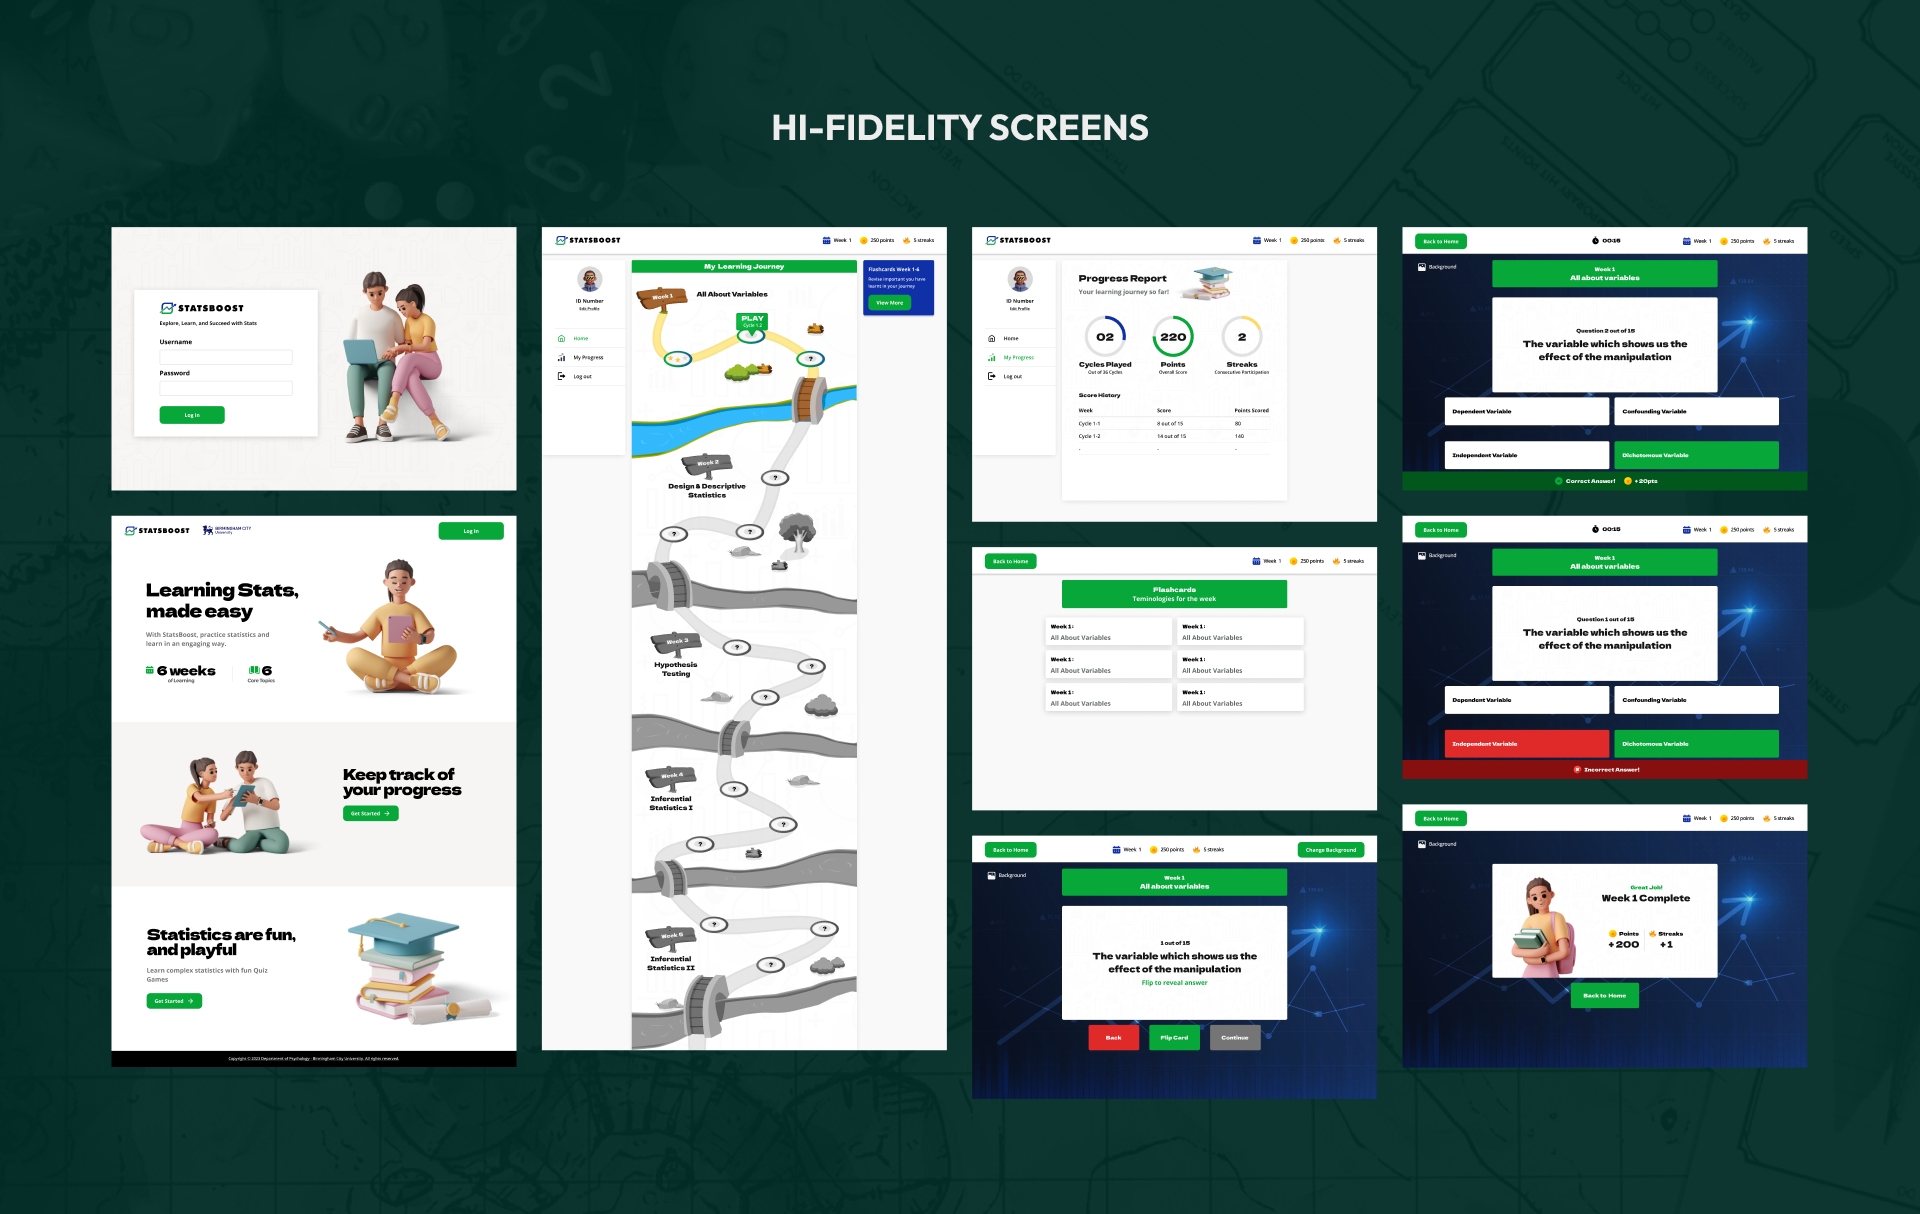
- High-Fidelity Prototyping: Designed high-fidelity wireframes for key user touchpoints like the landing page, game dashboard, flashcards, progress report, and quiz screens.
- Iterative Design Process: Incorporated usability feedback from user testing to refine the designs for optimal user experience.
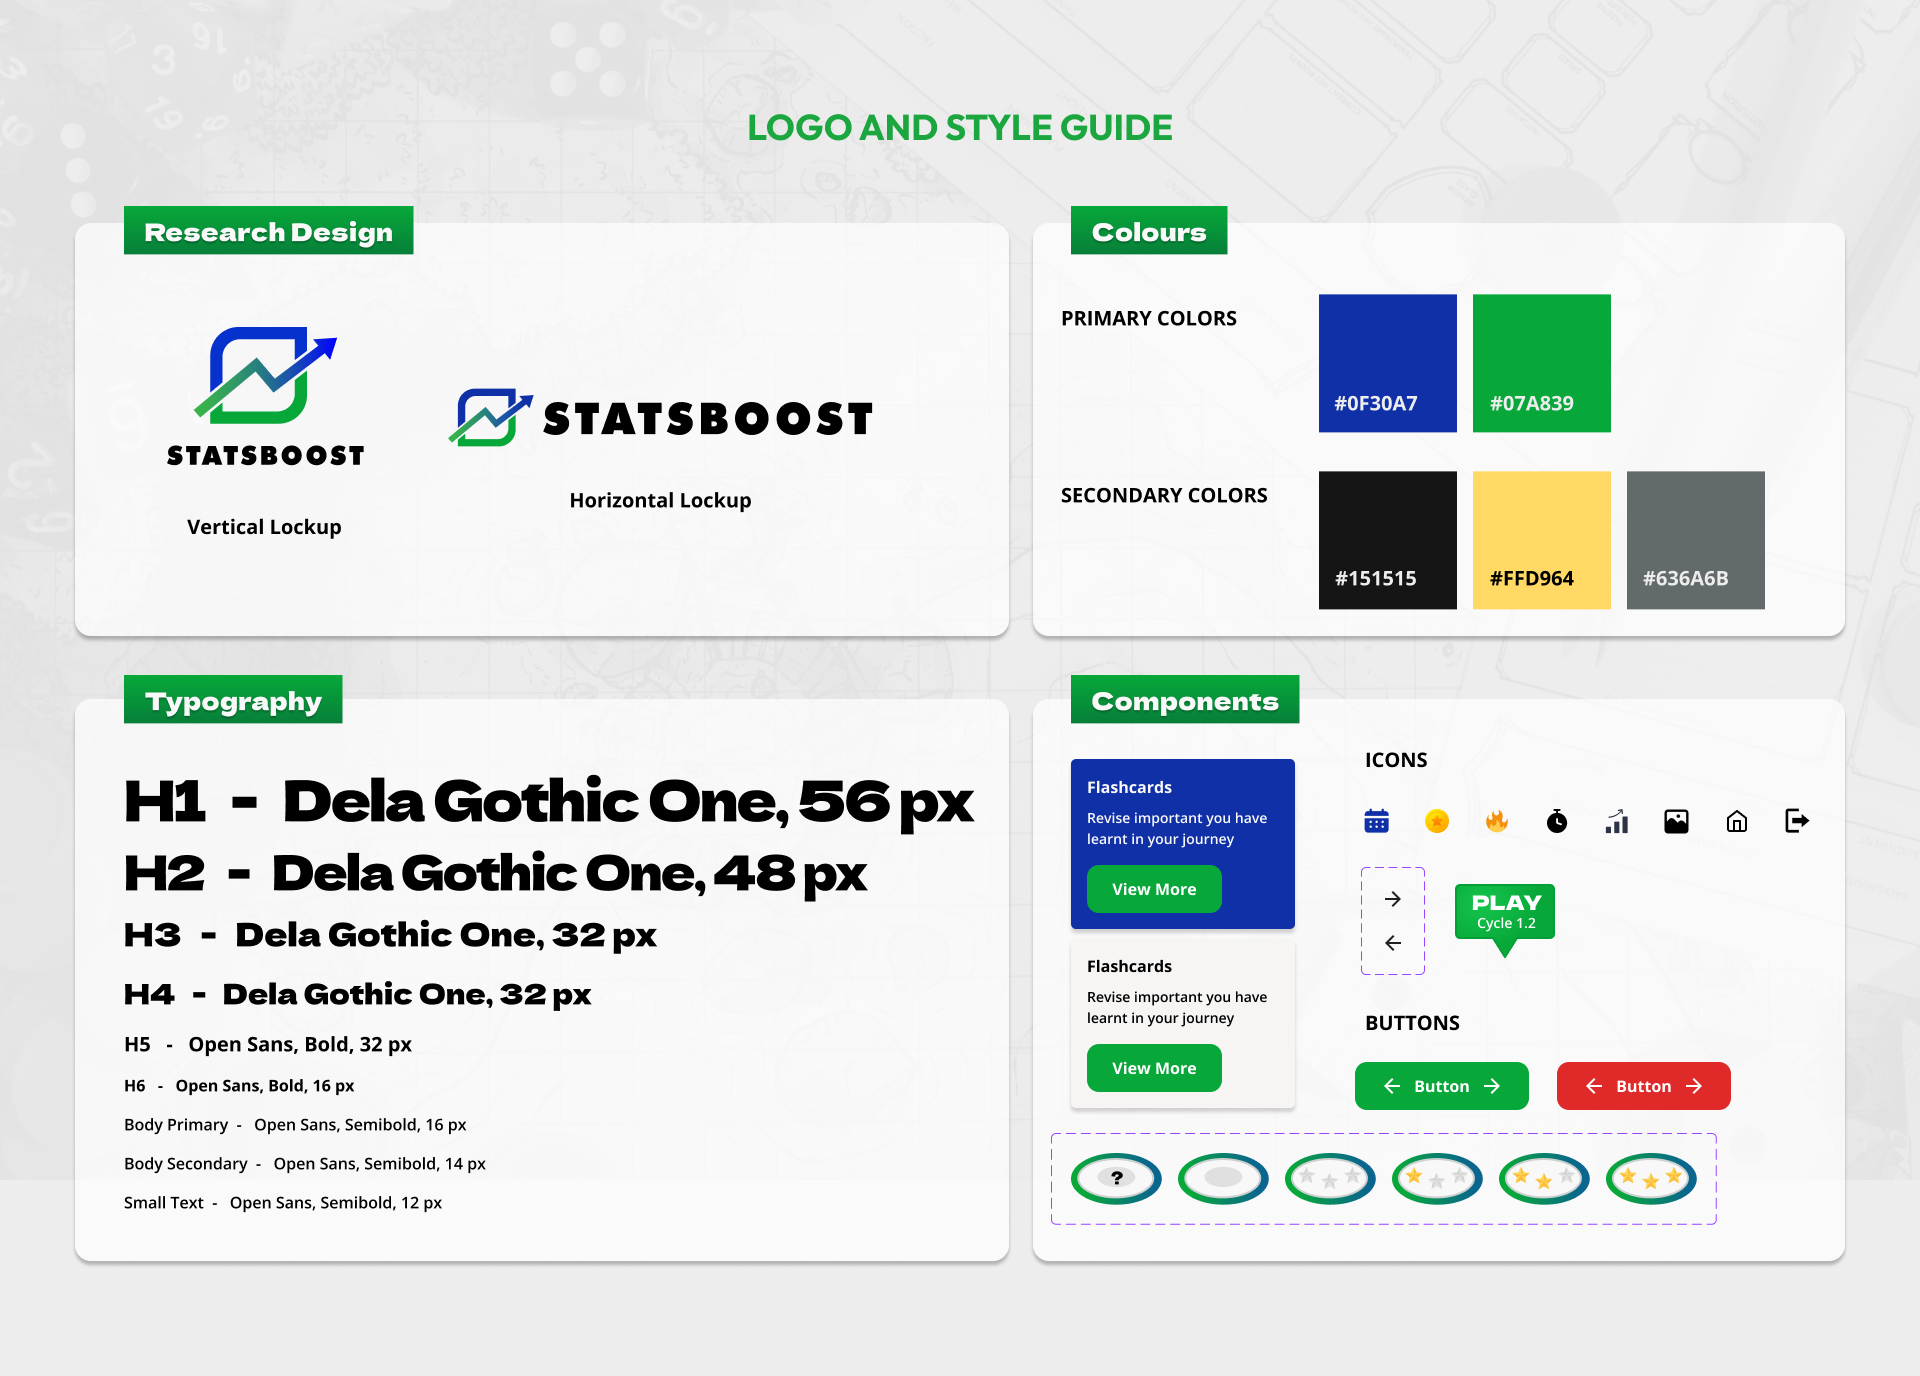
- Visual Identity & Branding: Created a unique logo and visual identity for the serious game, solidifying its brand recognition.
CLIENT
Dept of Psychology, Birmingham City University
INDUSTRY
Education
TEAM
Wenge Xu – Supervisor
Angel Tan – Co-Supervisor
Rachit Patni – UX Designer
Nonso Nweke (me) – UX Designer
Chloe Woodman – Software Developer
TOOLS
Figma, Adobe Illustrator, Photoshop, Teams
PLATFORM
Desktop App
Addressing Dropout and Motivation Issues in Statistics Education.
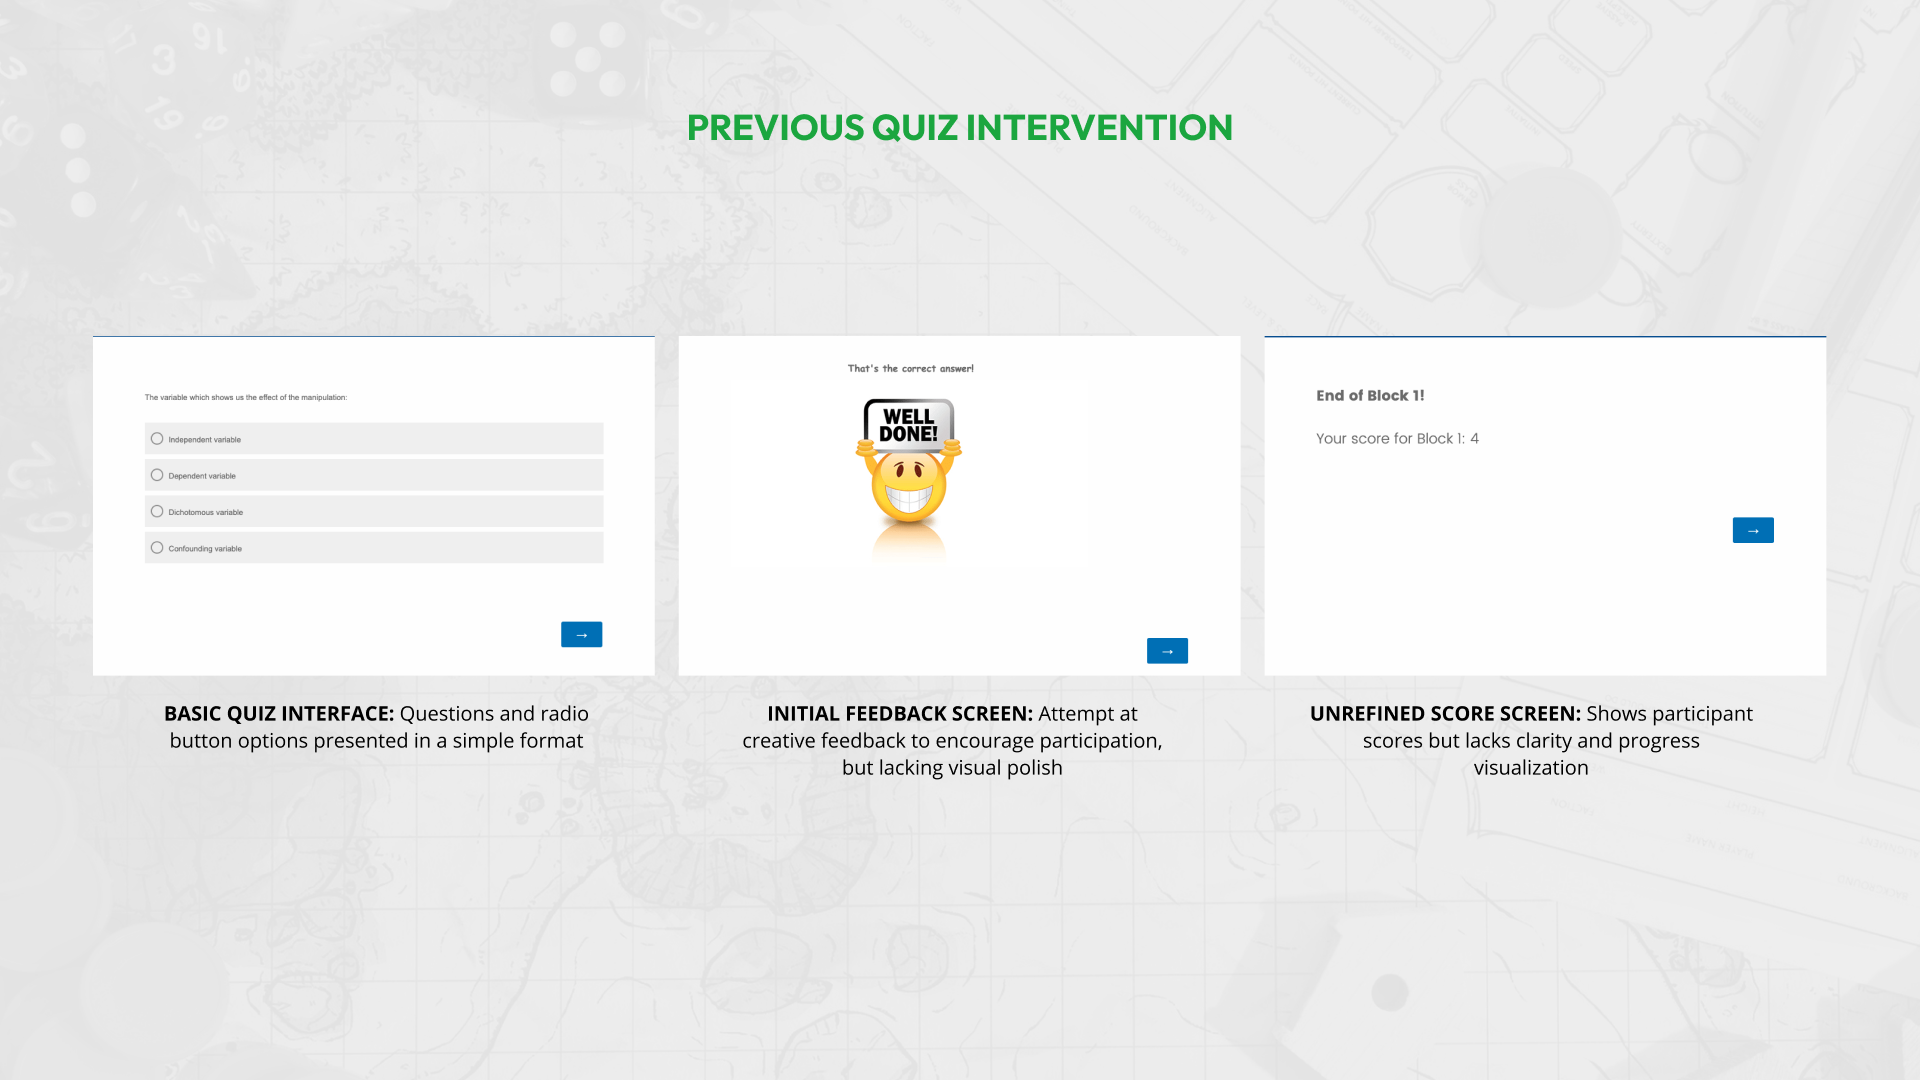
Building upon promising research by Tan et al. (2023) that demonstrated the potential of technology-enhanced interventions to improve statistics learning, this project encountered a significant challenge: a high dropout rate of 20% in a statistics intervention quiz designed to engage students in further learning activities.
This dropout rate wasn't the only red flag. A mid-module feedback survey revealed negative student feedback, highlighting a lack of motivation and characterizing the intervention as boring and monotonous, despite its effectiveness in breaking down difficult concepts.
In essence, the challenge lay not just in facilitating learning, but in creating an engaging and motivating experience that would keep students actively participating in the statistics learning journey.
Overcoming Educational Obstacles
To tackle the challenge of student disengagement and high dropout rates, our team implemented a four-pronged approach:
User-Centric
Design
By prioritizing user needs and preferences, we crafted an engaging, and user-friendly interface to keep students motivated.
Gamification
Elements
We incorporated elements of playfulness and competition, like points and badges, to transform statistics learning into a more enjoyable experience.
Progress
Visualization
Clear progress bars and visual indicators empower students by showcasing their achievements and encouraging further learning.
Bite-Sized
Learning
We broke down complex concepts into manageable units, making statistics less overwhelming and improving comprehension.
Early Design Concepts
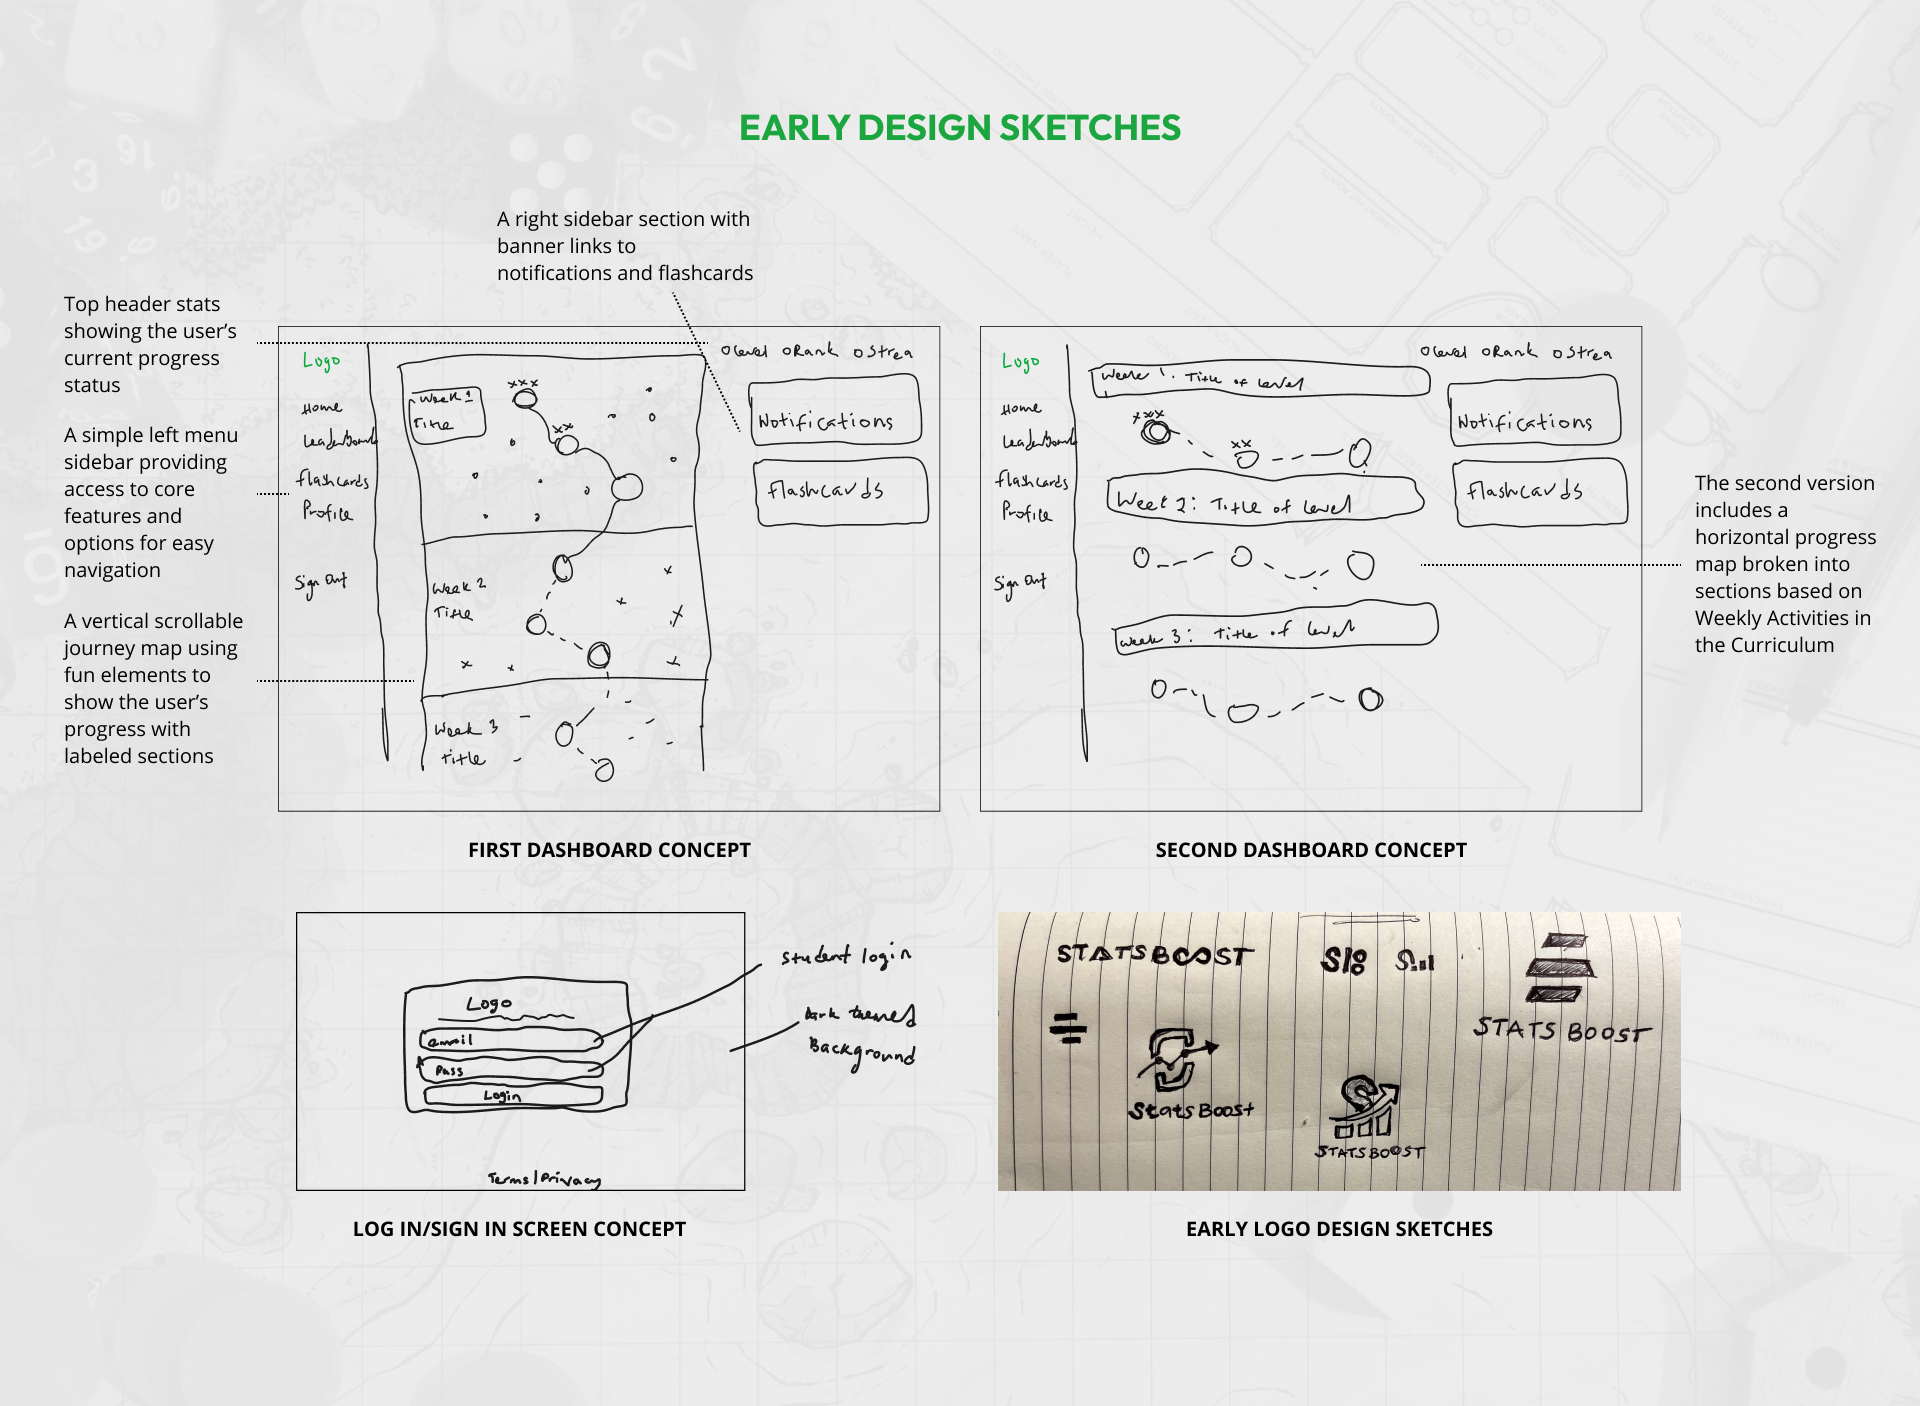
Informed by research findings, planned solutions, and competitor analysis, I began sketching initial design concepts for the dashboard and logo to share with the team and supervisors for feedback.
RESEARCHING THE ELEMENTS
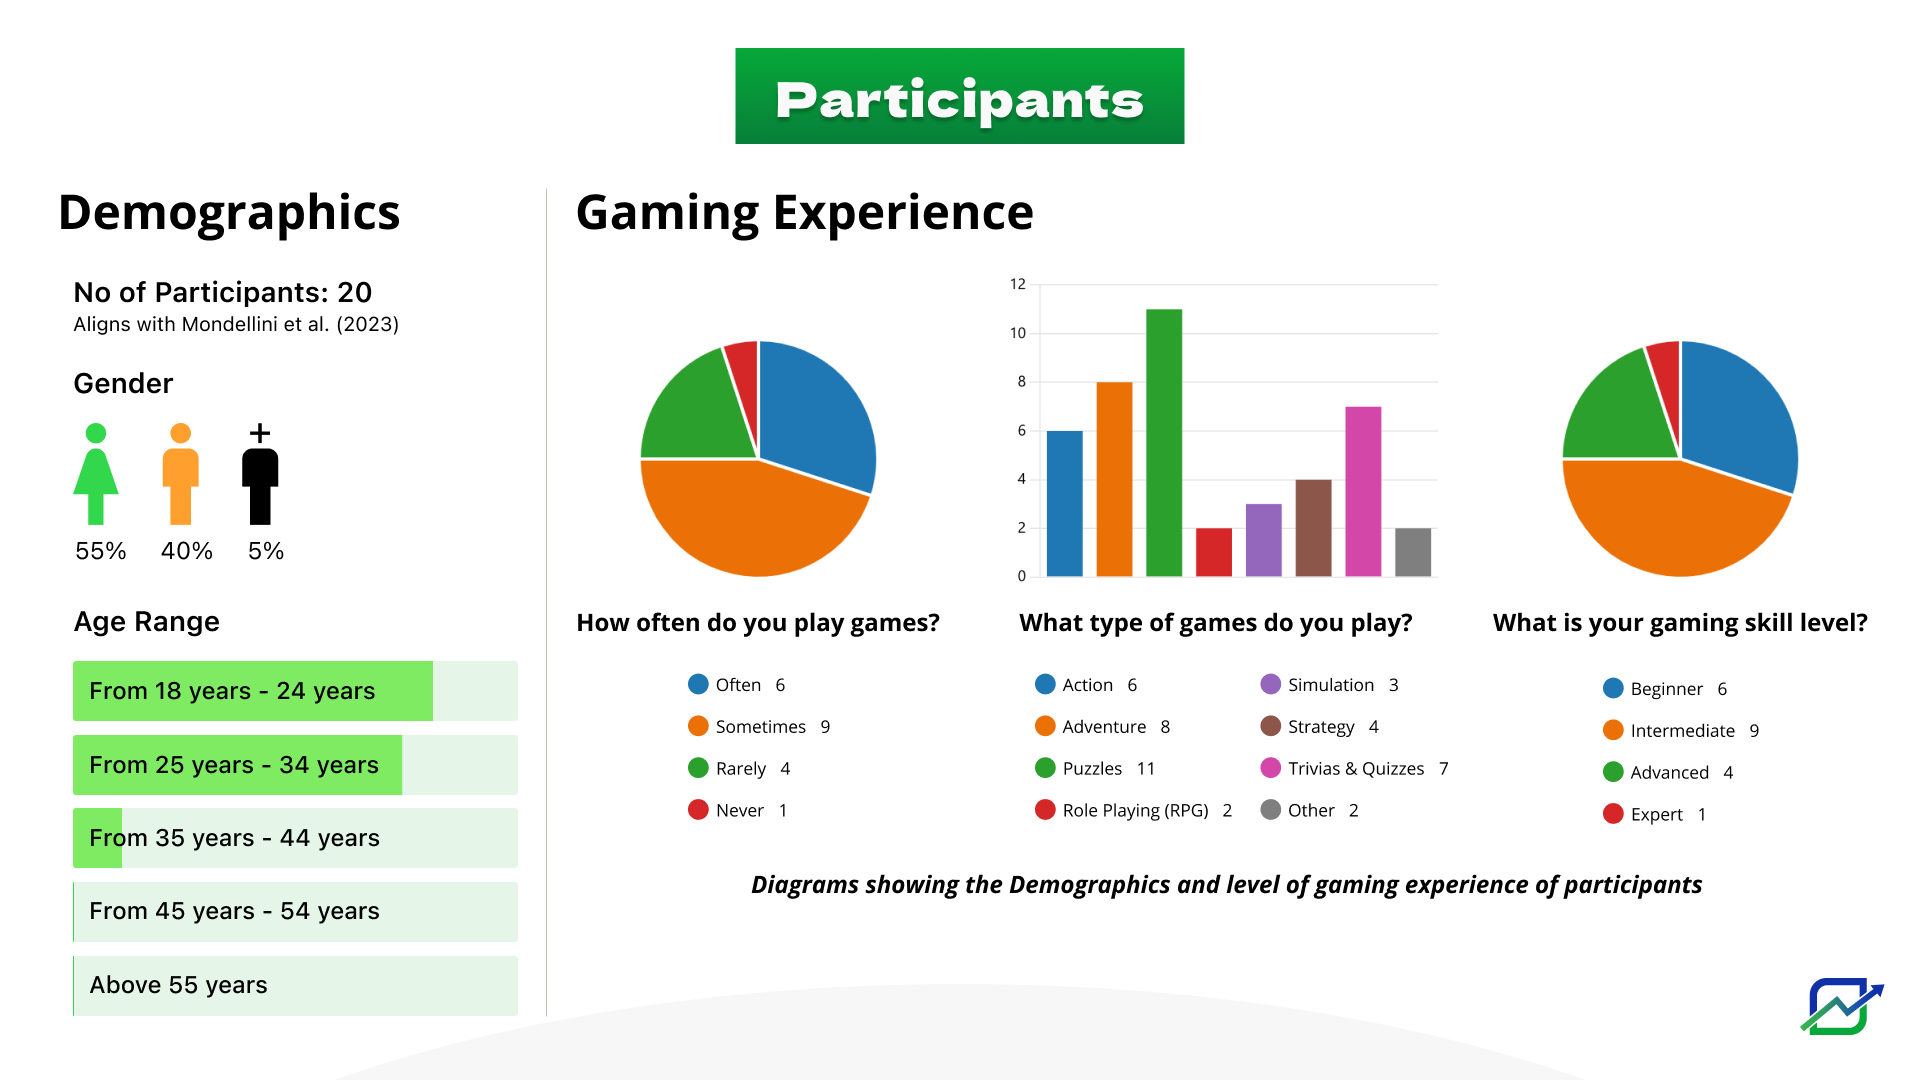
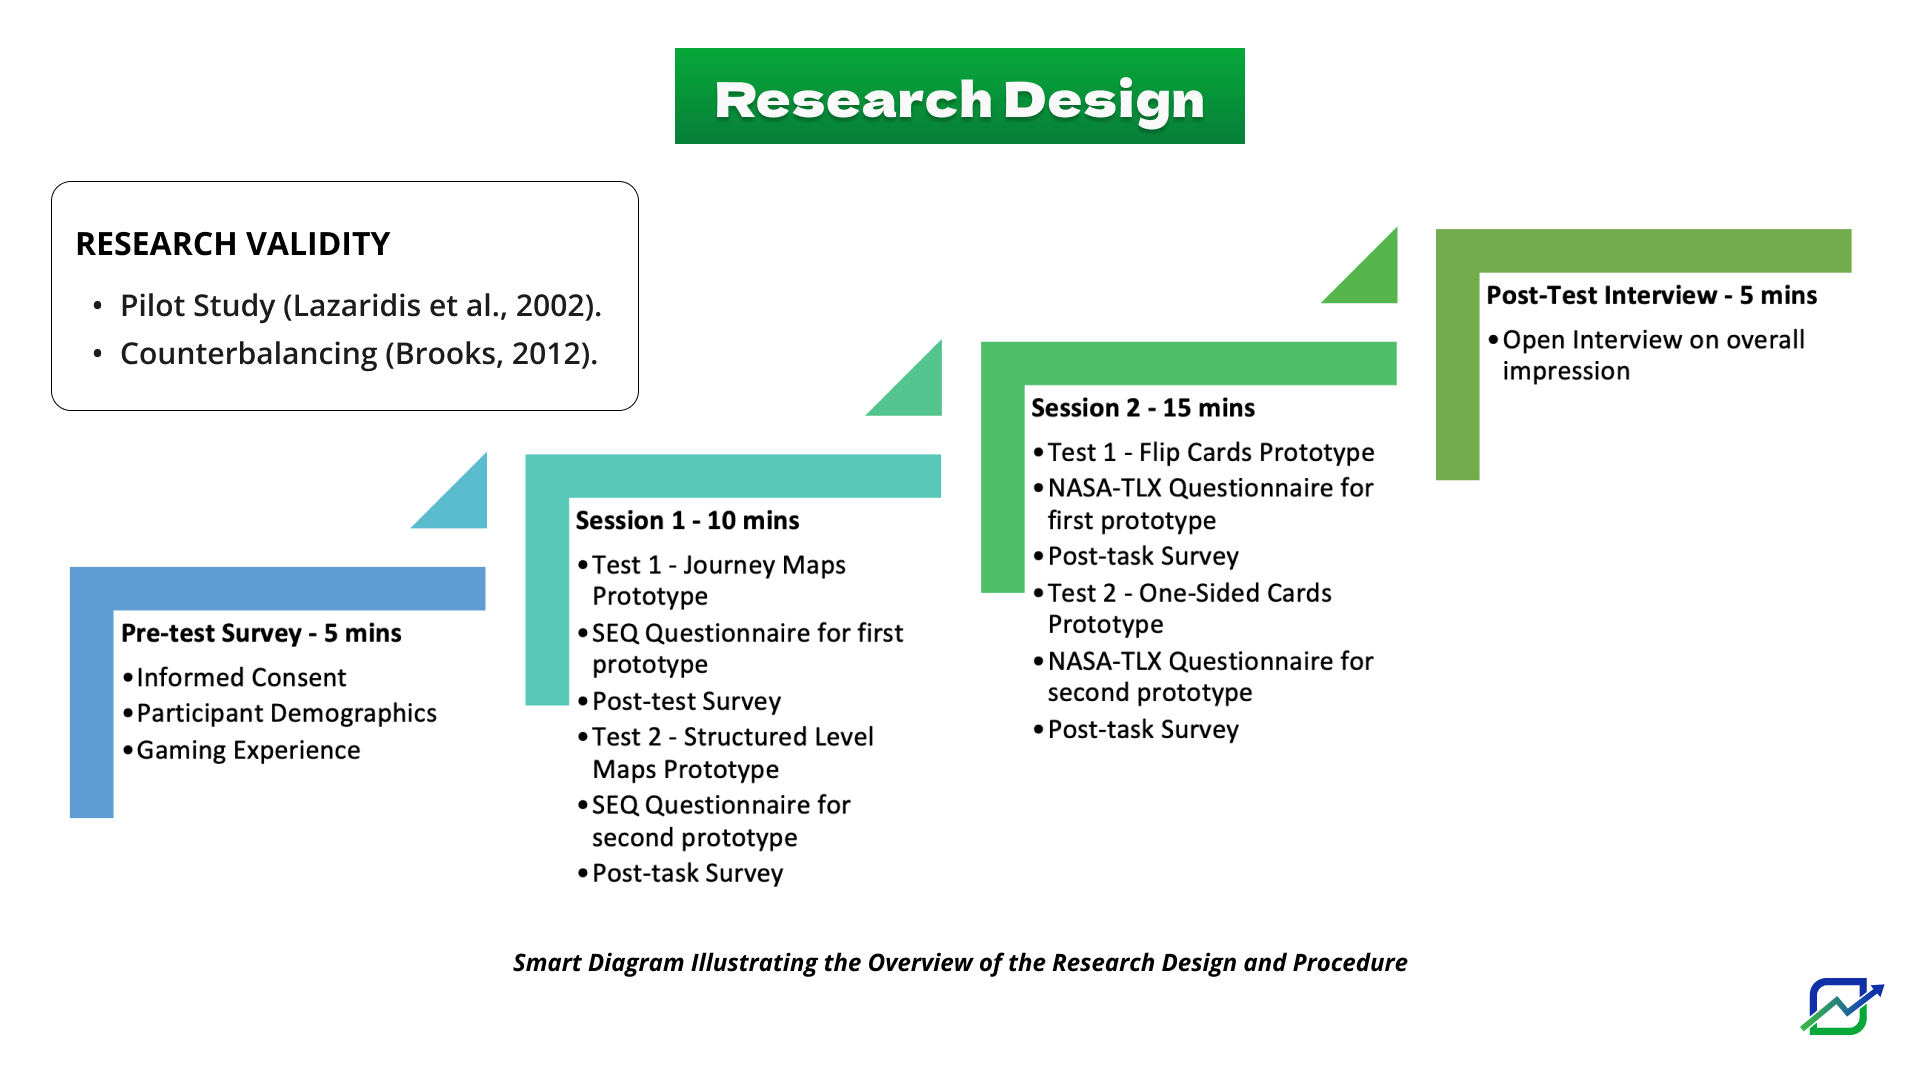
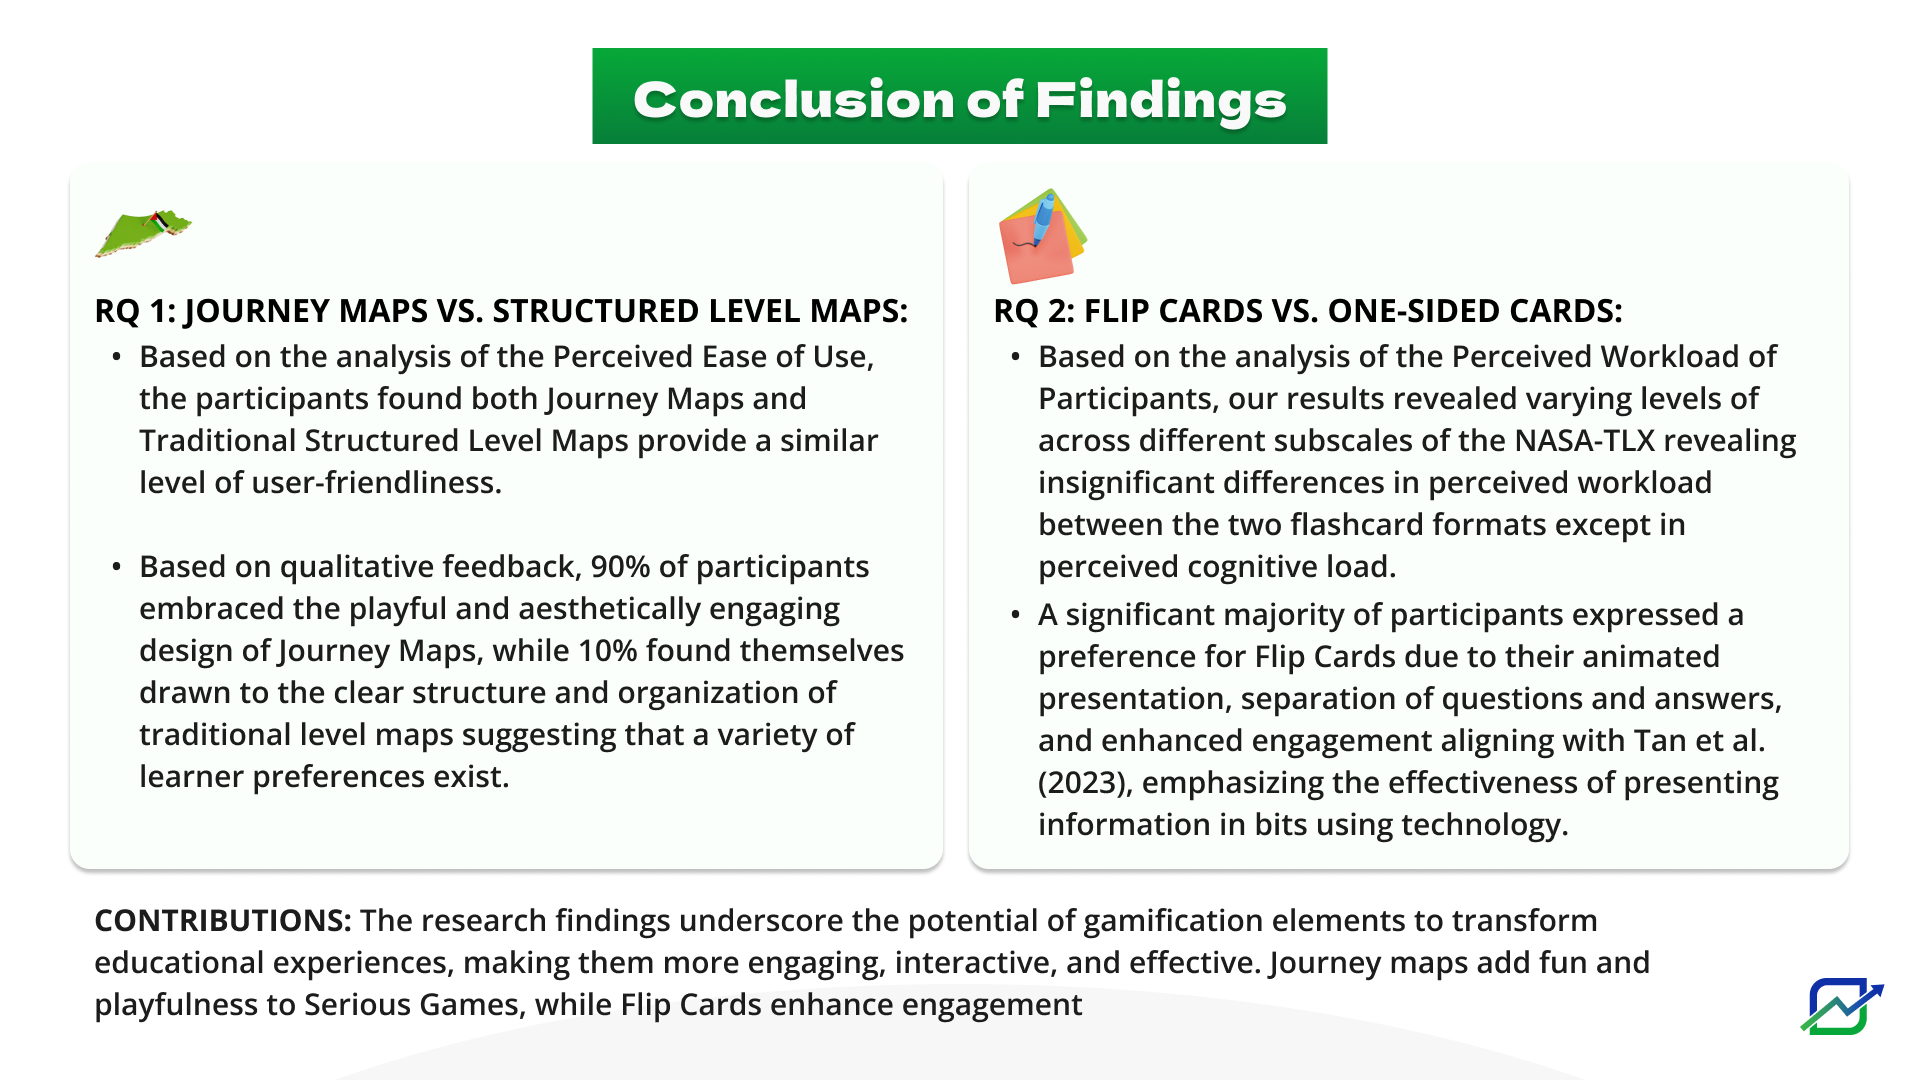
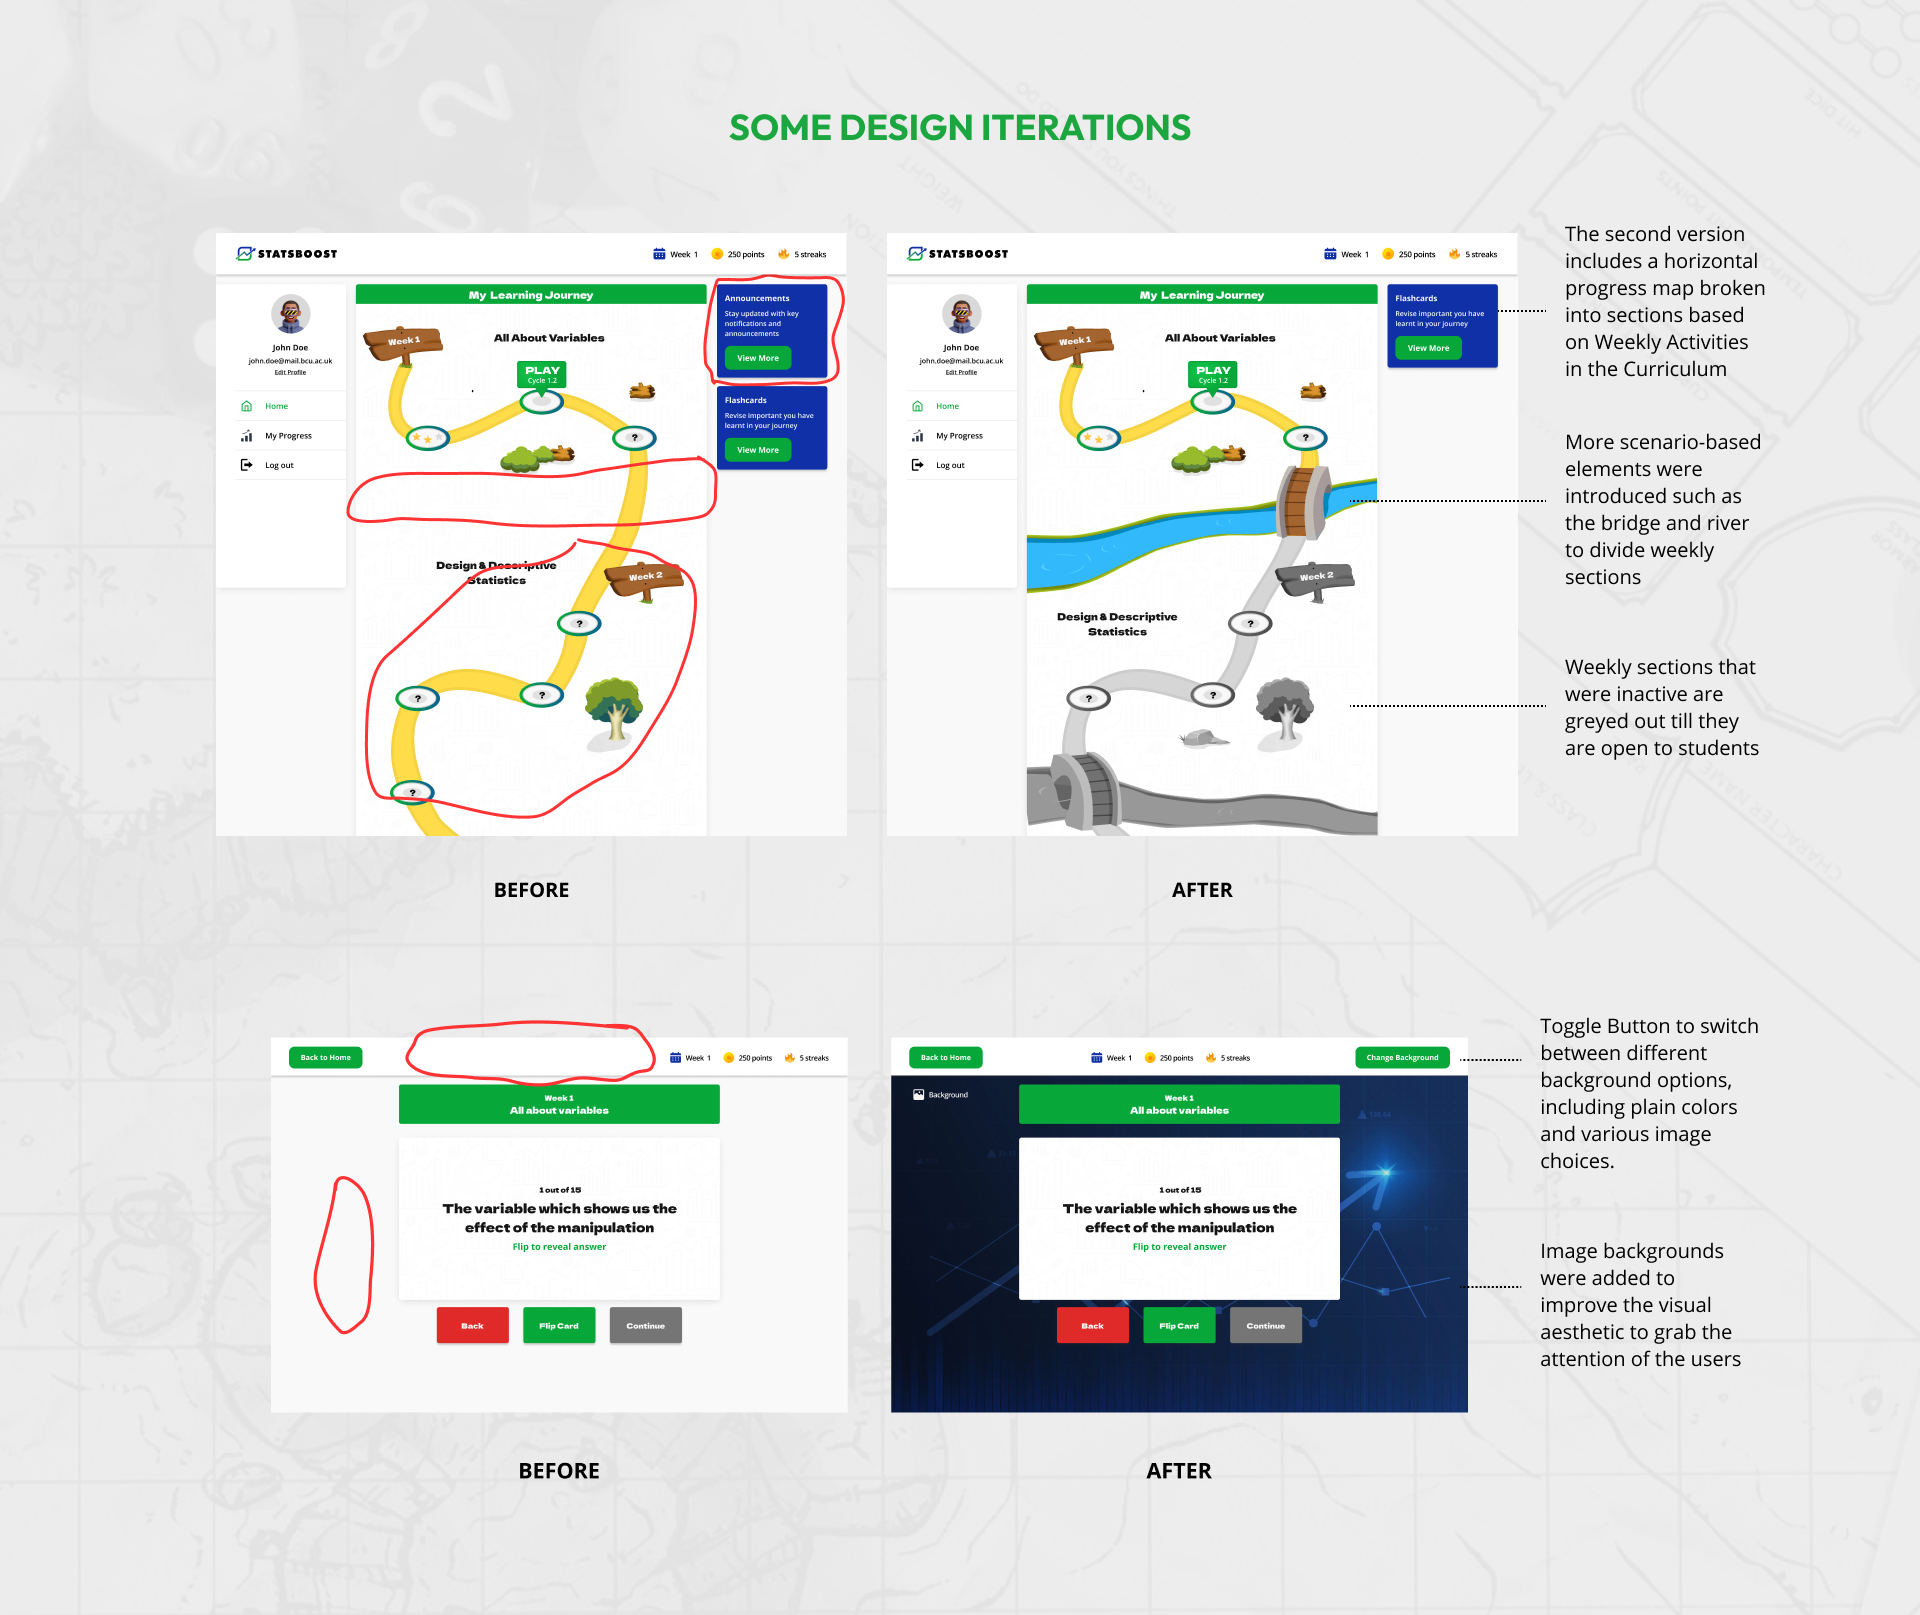
Design Iterations
Ensuring Consistency: The StatsBoost Style
IMPACT AND OUTCOMES
1. "The maps added a bit of liveliness and fun,"
2. "I'm excited to learn the course because it looks fun already,"
3. "It looks like a trivia game with a touch of adventure,"
5. "It was also easy; after the first click, I figured out that clicking the board shows the relevant answer once the board switches to the back."
6. "The flipping helped me focus on the answer and question separately compared to the direct version."
7. "It required me to pay attention to understand the meaning rather than just memorizing."
OTHER
KEY STATS
90%
85%
17/20
LESSONS LEARNT
Working on StatsBoost was a valuable learning experience. Here are some key takeaways from my experience on the project.
- The Power of User Research: StatsBoost reinforced the importance of user research. By understanding our target audience’s needs, preferences, and pain points (through surveys, interviews, etc.), we were able to design a solution that truly resonates with them.
- Collaboration is Key: The project thrived on effective collaboration between designers, developers, and potentially other stakeholders (e.g., educators, subject-matter experts). This cross-functional teamwork ensured all aspects of the project, from user experience to functionality, were carefully considered.
- Gamification Enhances Engagement: Gamification Enhances Engagement: StatsBoost’s integration of gamification elements (points, badges, leaderboards) proved to be a valuable lesson. By incorporating these playful elements, we were able to make learning statistics more engaging and motivating for users.
- Agile Approach Fosters Efficiency: StatsBoost’s success hinged on the implementation of an agile approach. The project likely involved weekly communication cycles, allowing for rapid feedback loops, iterative development, and a flexible response to changing needs and priorities. This highlights the effectiveness of agile methodologies in keeping teams aligned and projects on track
THANKS FOR STOPPING BY
Feel free to get in touch